
Share a card
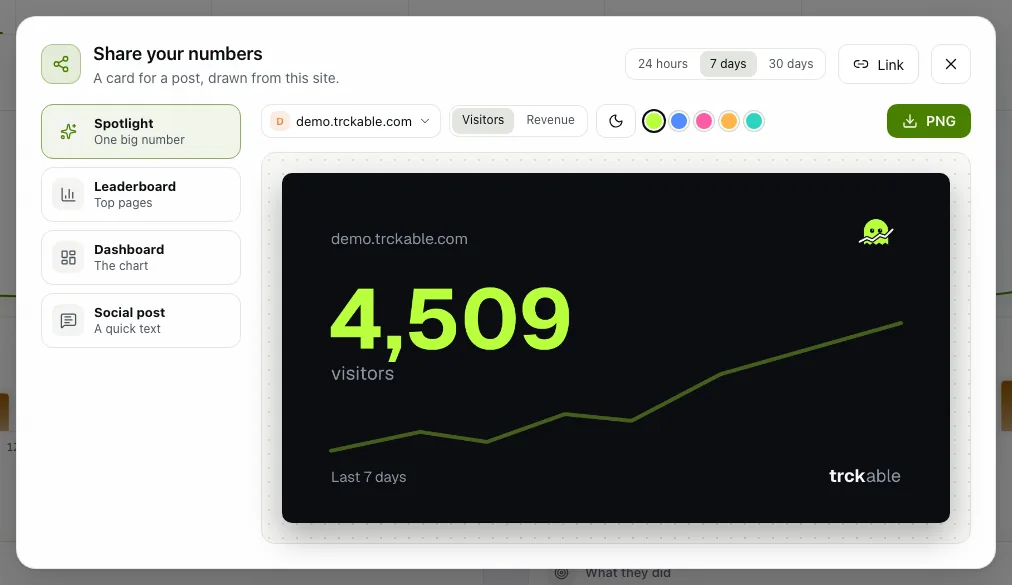
Click the share icon next to the period button. Share your numbers draws a card for a post from the site you are looking at. Pick the period (24 hours, 7 days or 30 days) and the card: Spotlight (one big number), Leaderboard (top pages), Dashboard (the chart) or Social post (a quick text). Choose the number it shows, a light or dark card and an accent colour, then download it with PNG.
Make a link
A card is a picture. For live numbers, click Link at the top of the same dialog: it makes a read-only link to this one site, with no account and nothing to change. You can set a password (optional) and choose whether revenue is shown, then Create link and Copy link.
Set the options for a link
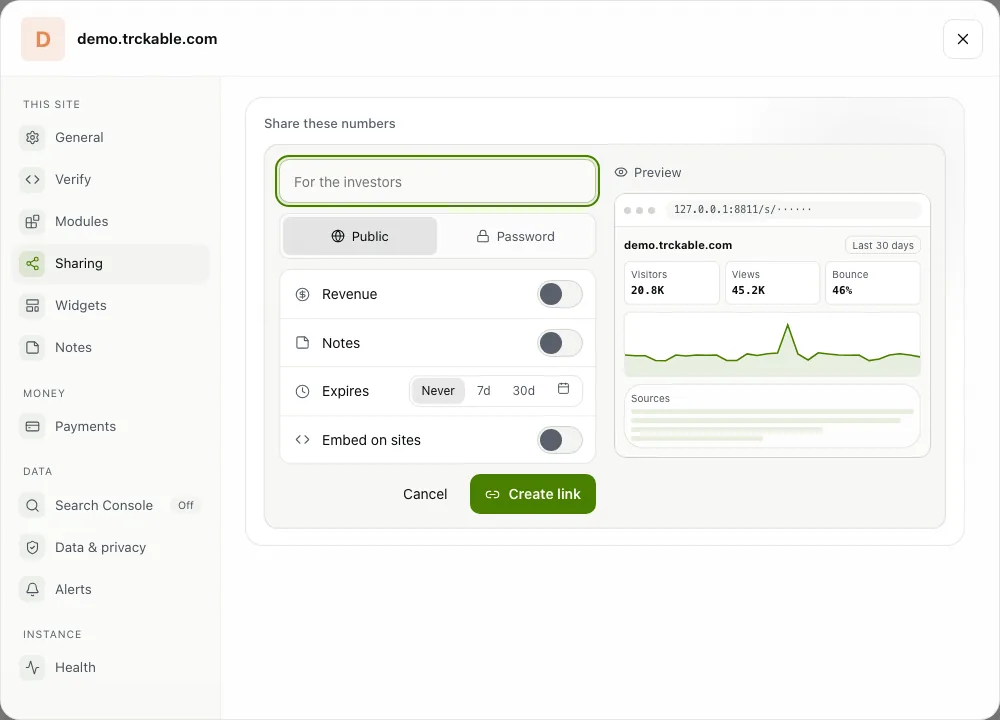
Every link lives in Settings → Sharing, where New link gives you more choices:
- Name, so you can tell your links apart, for example "For the investors".
- Public (anyone with the link) or Password (anyone with the link and the password).
- Revenue: with it off, the server never sends the figure, so it cannot be found in the page.
- Notes: whether the notes you wrote on the dashboard show on the page.
- Expires: Never, 7d, 30d or a date you pick.
- Embed on sites: list the addresses, such as
https://example.com, that may show the link inside their own page.
The Preview beside the form shows what people will see. Whether revenue is shown and where the link may be embedded are fixed once the link is made. To change them, make a new link.
Afterwards each link has a row with Copy, Open and a QR code, and shows how often it was opened. To end a link, choose Revoke on its row.
Export as CSV
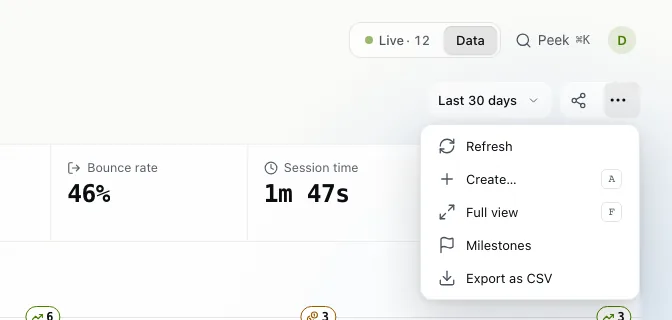
Open the ⋯ menu (More) next to the period button and choose Export as CSV. You get the numbers for the view you are looking at: the period and any filters you set. To pull the same numbers into your own tools, use the HTTP API.
The newsletter
Notes on measuring what matters.
Occasional emails from Albi: new posts, one chart worth reading, what changed in trckable.
We send one email to confirm your address, and nothing more until you confirm. Every newsletter has a link to leave. What we keep, and who sends it: privacy.